Wednesday, January 15, 2014
Pacific rock art - ordinations and networks
I have written previously about the use of phylogenetic networks as multivariate data displays instead of traditional techniques such as ordination (Networks can outperform PCA ordinations in phylogenetic analysis), and I have provided many empirical examples where I have used networks as heuristics to explore multivariate data. Here, I present a direct comparison between an ordination and a network.
Meredith Wilson (2004. Rethinking regional analyses of western Pacific rock-art. Records of the Australian Museum, Supplement 29: 173-186) has provided an interesting example of a difficult multivartiate dataset. She collated data (published and unpublished) concerning rock-art motifs (ie. engravings and paintings) for various locations in the western Pacific Ocean, including Papua - New Guinea, Solomon Islands, Fiji, Tonga, Micronesia and New Caledonia.
There were data for 614 figurative and non-figurative motifs, from 103 rock-art sites. However, this dataset is problematic to analyze because it contains a high proportion of unique motifs. This means that there is very little information about the art relationships among the sites, and the data summary is therefore uninformative. Wilson solved this problem by performing a series of analyses in which either (i) the motifs were aggregated into classes, or (ii) the sites were aggregated into geographical regions. Both strategies seemed to produce informative data summaries. In all cases, the data summaries were provided by ordinations, although some of these analyses used Multi-Dimensional Scaling while others used Correspondence Analysis.
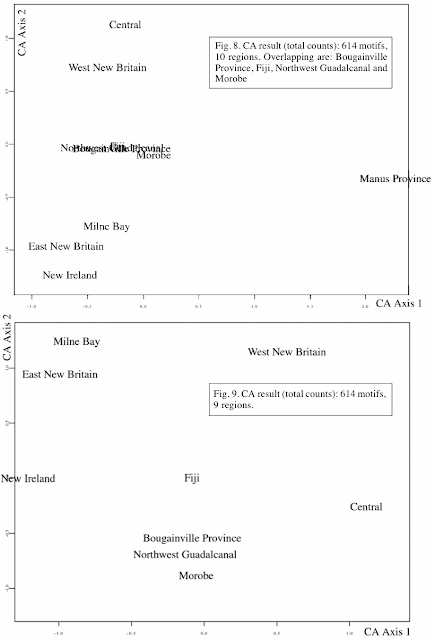
For one of her analyses (the one discussed here) she kept the 614 individual motifs but aggregated the sites into 10 regions, and then analyzed the data matrix using Correspondence Analysis. The data consisted of counts of the motifs in each of the regions, and the multivariate distances among the regions were measured using the chi-square metric.
Wilson presented two ordination diagrams, with different subsets of the data, as shown above. Two diagrams were necessary because several of the regions were super-imposed in the initial analysis, and so a second analysis was performed with some of the regions omitted, to explore the patterns among the super-imposed regions. As with all ordinations diagrams, it is the proximity of the regions in the graph that expresses their multivariate similarity — nearby regions in the graph have similar rock-art motifs.
For comparison, I have used a NeighborNet network, based on the same chi-square metric distances, as shown below. As usual, regions that are linked by short connections in the network are similar based on their rock-art motifs.
This diagram suffers from the same problem as do the ordination diagrams — it is difficult to see the relationships among the regions. In this case it is because the network structure occupies only a small part of the diagram, with very long terminal edges, indicating that most of the motifs are unique to particular regions. This issue can be dealt with by instead drawing the diagram with uninformative edge lengths (ie. they are all the same length), as shown in the next figure.
The relationships among the regions are now clear in the network. These relationships are the same as shown in the two ordination diagrams, except for Bougainville. The network associates the Bougainville rock art with that of East New Britain, whereas the ordination analyses associate it with the art of Northwest Guadalcanal and Morobe. I have been unable to explain this discrepancy.
This dataset is a difficult one to deal with, because the data matrix is sparse. This necessitates multiple ordination analyses, or a network with uninformative branch lengths. The network may be the simpler data summary in this case, because it requires only one analysis and graph, rather than the two separate analyses needed for the ordination. However, the analysis highlights the fact that any dataset that presents difficulties for one multivariate summary technique is likely to be difficult for all of them.
Labels:
EDA,
Ordination,
Rock-art
Subscribe to:
Post Comments (Atom)


No comments:
Post a Comment